
Irrigation, the largest human intervention in the water cycle.
Farms take most of the fresh water people withdraw. Irrigation ties rivers, aquifers, soil and crops together, so modeling it well captures much of how people reshape the water cycle.
Why irrigation matters
Fresh water on the planet is very limited.
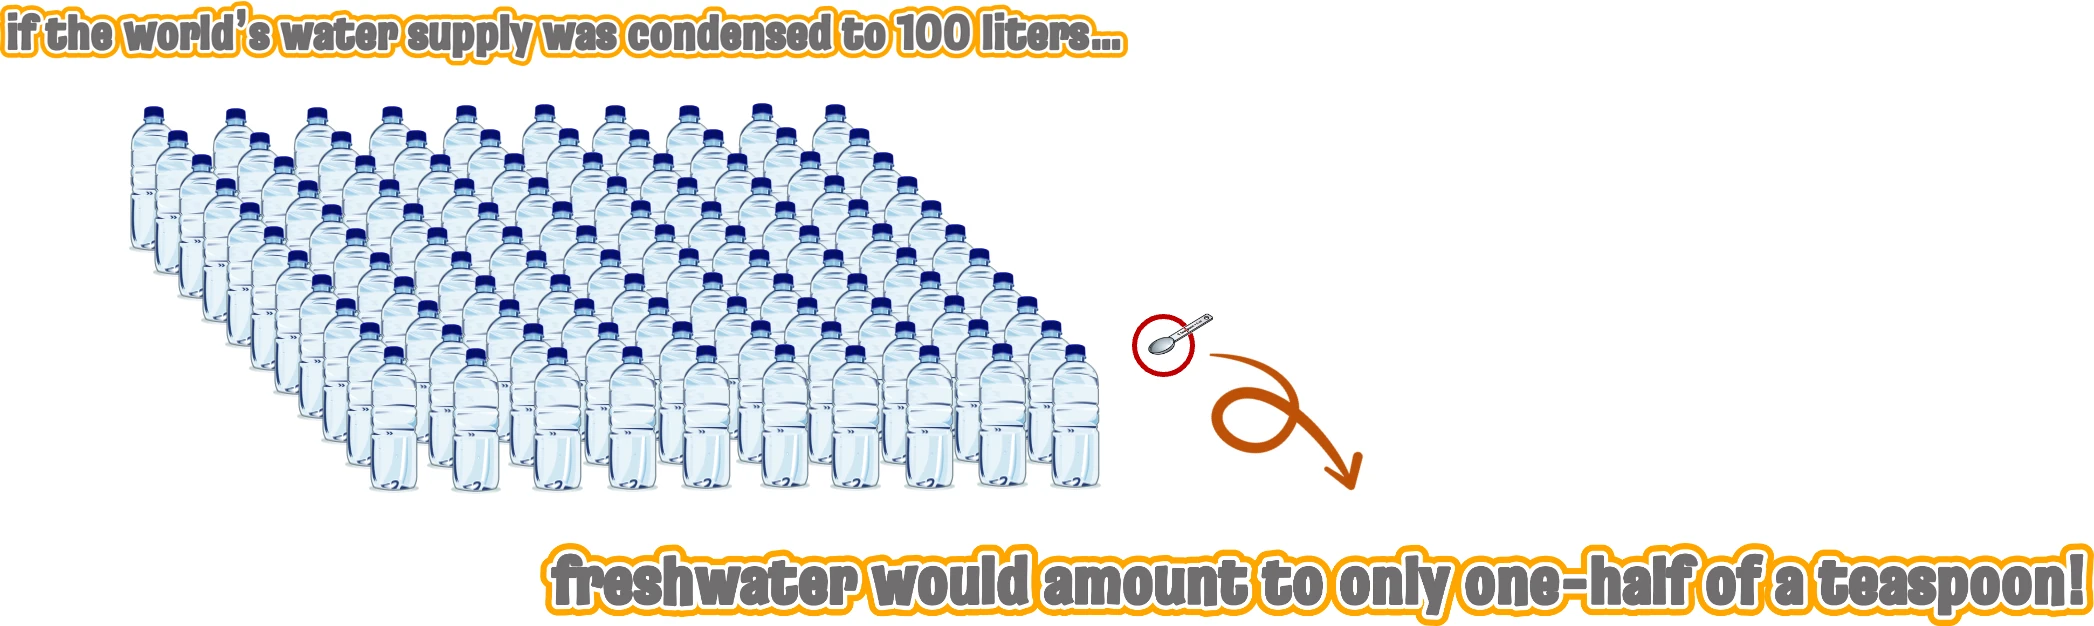

Salt water is 97.5% of Earth’s water, and most of the 2.5% that is fresh is locked in ice or deep underground. USGS
One of the greatest challenges of this century: doubling food production from resources that are already depleted.
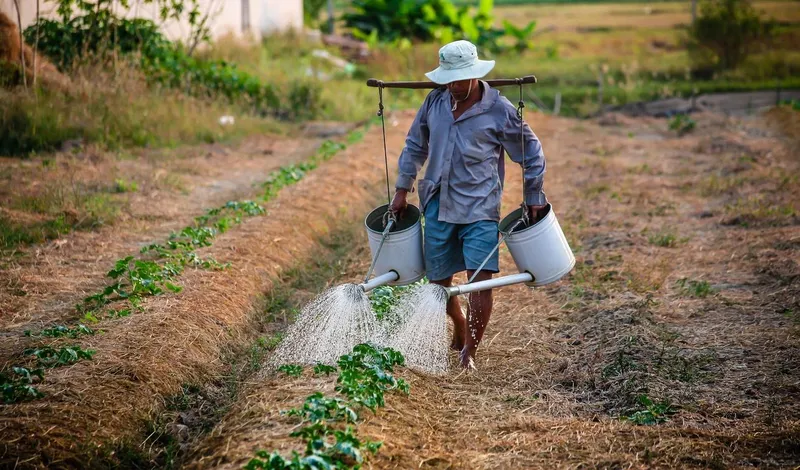
A food crisis is coming.
- About 2.3 billion people faced moderate or severe food insecurity in 2021. FAO, 2022
- Global food demand may double by 2050, about 30% from population growth and 70% from diets shifting toward meat. Tilman & Clark, 2015
- 42% of the world’s irrigated area is in just two countries, China and India, home to almost 40% of the world’s people. Szilagyi et al., 2020
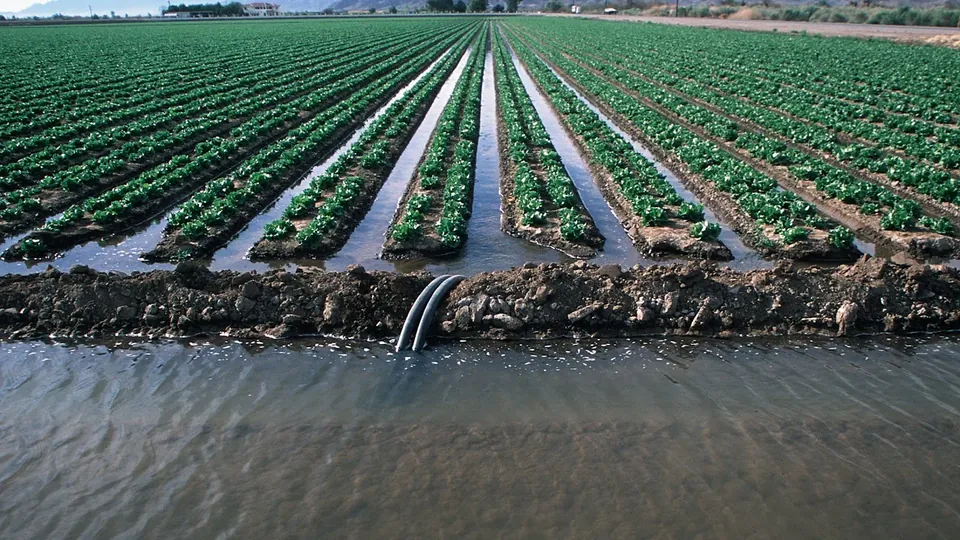
We need irrigation to grow more food.
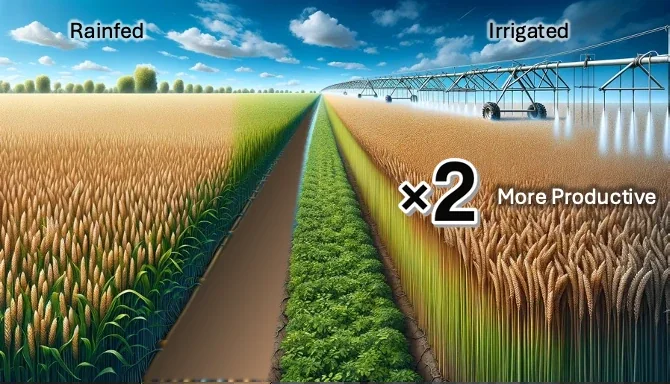
- Irrigated land is at least twice as productive as rainfed land. World Bank
But then we would have a water crisis.
- About 70% of the fresh water people withdraw goes to agriculture, and over 90% in parts of the Middle East and South Asia. Foley et al., 2011
- About 40% of the world’s irrigated area, and about 60% in the United States, relies on groundwater, and groundwater depletion roughly doubled between 1960 and 2000. Wada et al., 2010
Climate change makes it worse.
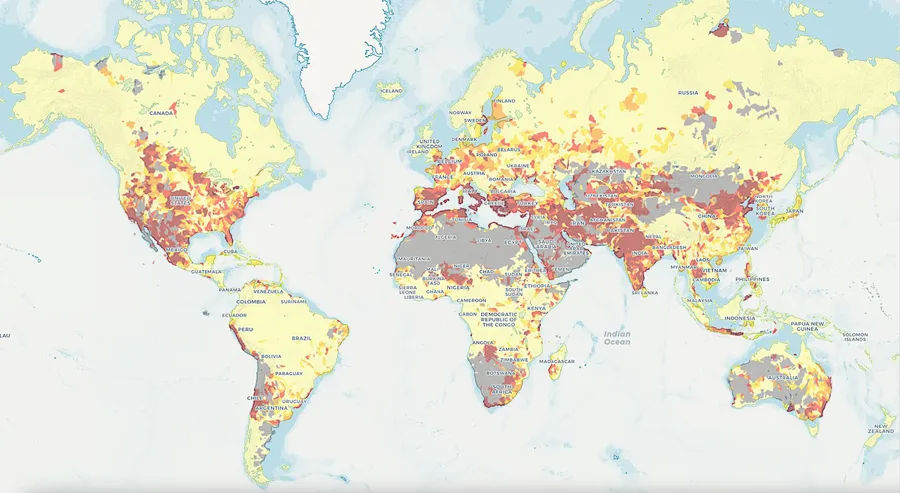 Water stress: how much of the available water is already in demand. Explore the map at WRI Aqueduct
- About two-thirds of the area equipped for irrigation in 1995 may need more irrigation water by the 2020s and the 2070s. Döll, 2002
- 41% of irrigation water is taken from the flow rivers need to stay healthy, harming ecosystems and habitats. Jägermeyr et al., 2017
- Irrigation in Europe could rise by about 30% under a high-emission scenario. Busschaert et al., 2022
- Competition for water is already intense and is expected to get worse. WRI Aqueduct
Irrigation changes the climate around it.
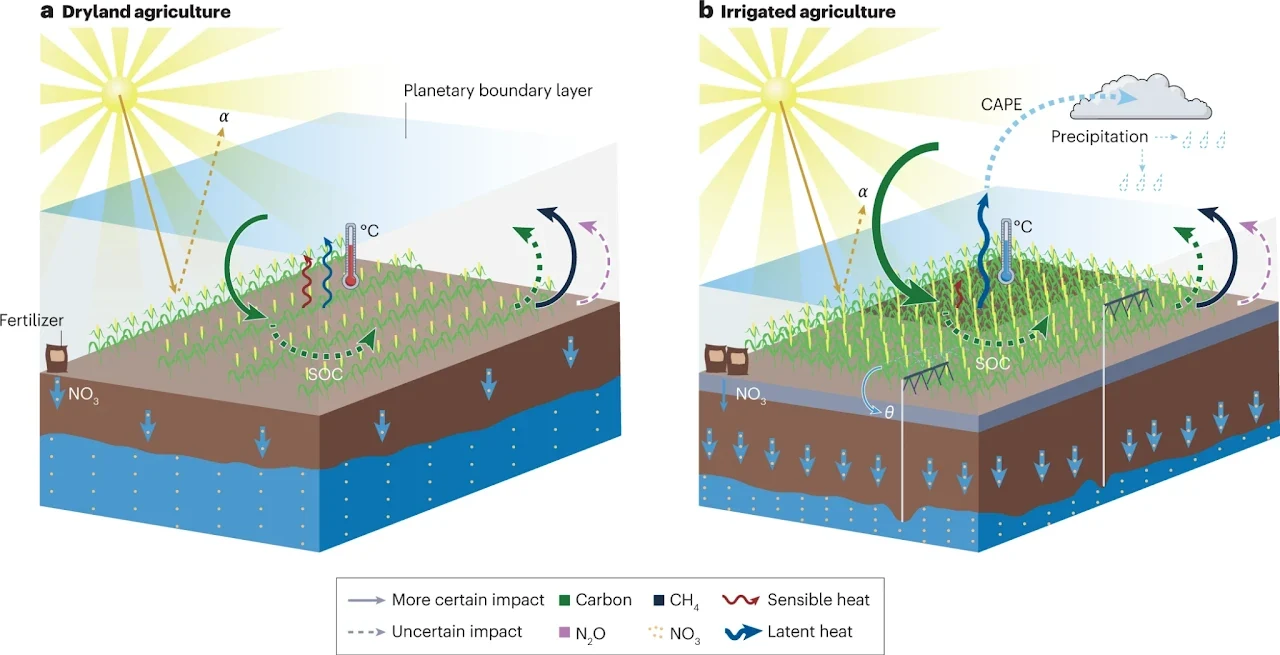
- It can turn evaporation from limited by water to limited by energy, changing the land’s water and energy budgets. Taylor et al., 2012
- Groundwater-fed irrigation has raised downwind rainfall and streamflow by up to 30% in the US High Plains and California’s Central Valley. DeAngelis et al., 2010 Kustu et al., 2011
- Less obviously, large-scale irrigation can suppress rain over the irrigated area itself. Szilagyi et al., 2020
- It cools the hottest days of the year. Thiery et al., 2020; Lawston et al., 2020
- It can delay the onset of monsoons. Tuinenburg, 2013
- It can create humid heat waves beyond what people can tolerate. Raymond et al., 2020; Wang-Erlandsson et al., 2022
The gap: no one knows how much water each farm uses
To manage water withdrawals, we first need to monitor them, and measuring them on the ground is hard.
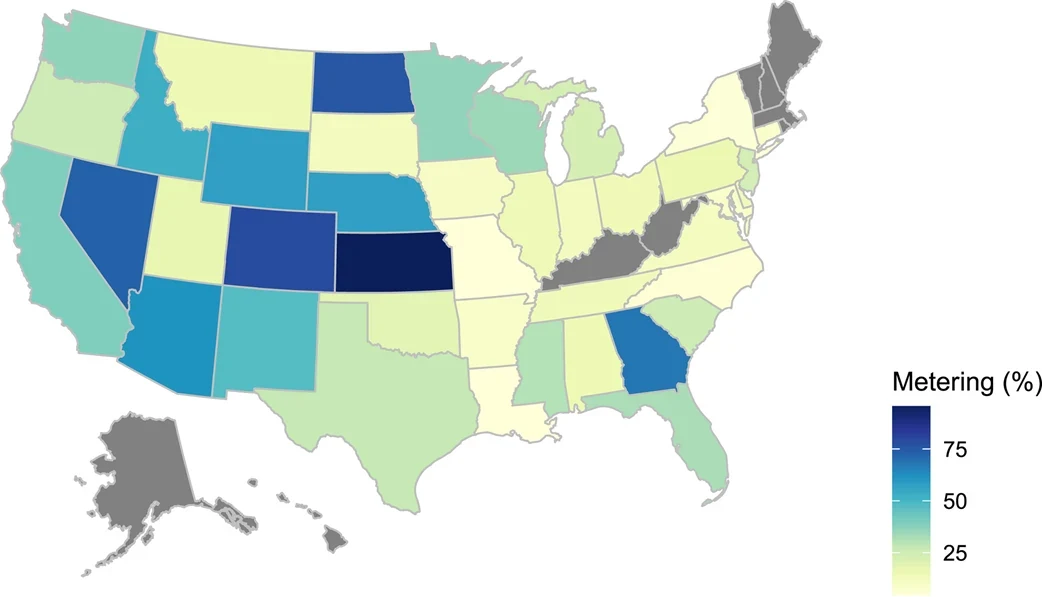
- Meters are costly to install and labor-intensive to read, even in wealthy countries.
- Some water is taken illegally from rivers and aquifers, and never shows up in the records.
- Farmers may oppose or lobby against meters, fearing more regulation in the future. Foster et al., 2020
We can use models to estimate irrigation, but modeling it is hard.
- The crops grown change constantly, from season to season and year to year (crop rotation).
- Farmers’ decisions to irrigate do not necessarily follow what the crop needs.
- Farmers often go by rules of thumb: a change in leaf colour, curling leaves and, in the end, wilting; or leaf temperature, since a cool leaf on a hot day means a well-watered plant, and a warm one a thirsty plant.
- Most models estimate the irrigation crops require, not the irrigation farmers actually apply.
Satellites revisit every field every few days. My work asks how much of the irrigation signal they can recover, and at what scale. It started with a shortcut: irrigation changes the soil moisture, so soil moisture can stand in for it.
My irrigation studies
Every answer revealed another question
It began with a signal that rainfall could not explain. Each study since answered a question the last one raised, so the work ran backward, from how much to when to where, and now comes full circle to how much with all three. Open any chapter to read its full story.
Essential reading
The research landscape
Studies from across the field that use satellite data or Earth system models to find where, when and how much farms irrigate. A small agent looks for new papers every week, and I review each one before it is added.
- 1SearchEvery Monday the agent searches OpenAlex for new irrigation studies.
- 2ReadClaude reads each abstract and fills in the table’s columns.
- 3ReviewI check every proposed paper before anything is published.
- 4Follow upPreprints switch to the peer-reviewed version when it appears.
See the agent’s code on GitHub ↗
Loading studies
| Status | Questions answered | Data & code |
|---|
Related agricultural work
Collaborations on crops, yield and agricultural water management.